Risk Management Is a Decision Structure, Not a Register
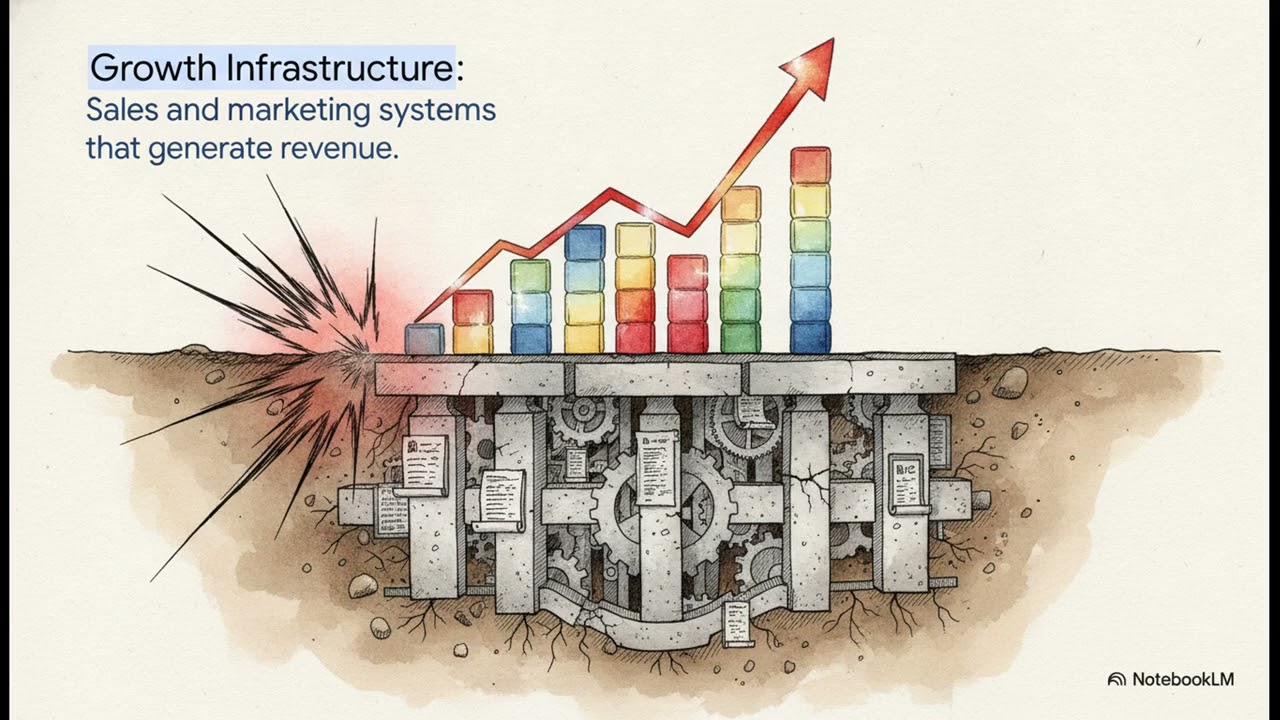
Risk management in a mid-market company is a decision structure rather than a document. Most programs produce a register that lists exposures, assigns owners, and gets reviewed on a cycle. That artifact creates the appearance of control while scoring the wrong arithmetic entirely.
The register runs an average that no single company experiences
A standard register scores each exposure on likelihood and impact, then multiplies the two. That product is an expected value, and expected value is the correct instrument for a party facing the same situation repeatedly. An insurer occupies that position across thousands of policies.
A mid-market company does not occupy that position at all. The distinction is operational rather than academic, and it changes the ranking. Expected value averages across branches that one business only ever travels once, so an exposure carrying a small chance of ending the company scores low. That score is arithmetically correct and useless for the decision at hand.
Survivability is the threshold that governs everything else
The load bearing question is not what an exposure costs on average. It is whether the business is still operating in the branch where the exposure actually lands. Those two questions produce different priority orders and different spending decisions.
Sort exposures into two classes before scoring any of them. The first class threatens continuity, meaning normal operation does not resume afterward. The second class produces cost, disruption, and discomfort without ending anything.
Rigor here means refusing to blend the two classes into one ranked list. A single list invites trading a continuity exposure against several expensive ones, and that trade is never sound. Continuity exposures get handled first and separately, whatever the product of two estimates happens to say.
Inherent exposure, residual exposure, and the gap nobody tests
Registers almost always record residual exposure, meaning what remains once controls operate. Inherent exposure is what exists before any control at all. The distance between those two figures is a claim about how well the controls work.
That claim is rarely tested after it is first made. The residual figure gets entered when the control is designed, then carried forward unexamined through every subsequent review cycle. Nobody returns to ask whether the control still operates, so the register quietly becomes a record of intentions.
Design effectiveness and operating effectiveness are separate claims
Audit practice separates these two, and the separation is worth borrowing wholesale. Design effectiveness asks whether the control would prevent the exposure if it ran exactly as specified. Operating effectiveness asks whether it actually ran.
Most controls in a growing company pass the first test and fail the second. The control depends on somebody remembering it during a week when attention is fully consumed by a live problem. That is precisely the week the exposure tends to arrive.
The inexpensive version of this test takes an afternoon. Pick one control, find the recent instances where it should have fired, and confirm in the record that it did. What the register says about that exposure is now evidence rather than assertion.
Correlation is what turns a list into an event
A register presents exposures as independent rows. Real failures rarely arrive as one row. They arrive as several rows moving at once because a single underlying driver moved all of them together.
A downturn compresses a large customer's payment behavior, tightens the credit facility, and stresses a thin supplier simultaneously. Each row was scored separately and each score was defensible in isolation. The combined position was never scored, because no line on the register represents it.
Ask which rows share a driver before scoring any of them individually. Group the rows that move together and score the group as one exposure. Coherence between those groupings and the real operating dependencies is what separates a risk model from an inventory.
Concentration is the shared driver nobody logs
The most common shared driver in a mid-market business is concentration. One customer producing most of the revenue, one supplier holding a critical input, one person carrying knowledge that exists nowhere in writing.
Concentration rarely appears as a register row because it is not an event. It is a standing condition, and registers are built to hold events. That condition nonetheless determines how severe every event on the list becomes when it arrives.
Measure it directly rather than waiting for it to express itself. Revenue share by account, single-source inputs, and functions where one departure stops the work are all countable in a morning. Each is a continuity exposure regardless of what happens this quarter.
Four treatments exist and most registers use one
An exposure can be avoided, reduced, transferred, or deliberately retained. Registers overwhelmingly record reduction, because reduction is the treatment that produces a visible control and a satisfying entry in the document.
The other three are decisions rather than absences. Avoidance means declining the work that carries the exposure. Transfer means insurance or a contractual term moving the consequence to a party better positioned to absorb it. Retention means the organization has examined the exposure and chosen to carry it.
Retention is the treatment most often applied without ever being decided. An exposure sitting through successive cycles without movement has been retained by default, and default retention has no analysis standing behind it.
Bow-tie analysis puts barriers on both sides of the event
Bow-tie analysis is one of the few risk methodologies that survives contact with an operating business. The top event sits in the middle of the diagram. Threats that could cause it run in from the left, and consequences that follow it run out to the right.
Preventive barriers sit on the threat side, mitigative barriers on the consequence side. Most programs construct only the left half of that diagram. The organization has then invested entirely in the event never occurring and not at all in surviving it.
Drawing one requires a whiteboard and an hour. The value sits in the right half, because that is the half nobody has considered and the half deciding whether a bad quarter becomes a terminal one.
Layered barriers fail through aligned gaps
James Reason described accident causation as a series of defensive layers, each carrying holes. Failure occurs when the holes in successive layers line up and a threat passes cleanly through all of them.
The organizational reading of that model is specific and uncomfortable. Barriers sharing a dependency carry their holes in the same position. Three controls that all require the same person to notice something are one control described three times.
Check barriers for shared dependencies rather than counting how many exist. Independence is the property making layered defense work at all, and it is the property most commonly missing in a small operation where a few people hold everything.
Indicators that move before the event rather than after it
Most risk reporting counts activity because activity is easy to count. Items logged, reviews held, controls documented, attendance recorded at the quarterly session. None of those describe whether exposure is rising or falling.
A risk indicator differs from a performance indicator in direction rather than in format. A performance indicator reports what already happened. A risk indicator moves ahead of the event, and that property is the only reason to watch it.
Useful ones are usually dull and already sitting in the systems. Days of cash coverage, revenue share held by the largest account, elapsed time from signal to decision. Consistency in tracking a few of these beats sophistication in tracking many.
Where the standard says this work actually belongs
ISO 31000 makes an argument that most implementations quietly ignore. Risk management is described as part of decision making rather than as a parallel process reporting on decisions taken elsewhere.
That placement is effectively the whole content of the standard. A separate function reviewing decisions after the fact produces documentation. Risk criteria applied inside the decision itself produces different decisions, which was the intended outcome.
The practical translation is small and cheap to build. Every recurring decision class carries a stated threshold above which the decision changes route. Below that threshold the owner proceeds without consultation and without apology.
Conditional rules for a mid-market register
Where an exposure could end the business, lift it out of the ranked list and handle it on its own. Ranked lists invite trades that are unsound the moment one side is terminal.
Where a control has never been tested against a real instance, record the inherent exposure rather than the residual one. An untested control is a plan, and plans do not reduce exposure.
Where several rows share an underlying driver, score the group instead of the rows. The business is exposed to the driver, not to the individual lines describing it.
Where an exposure has survived successive reviews without treatment, mark it retained and name the person retaining it. Default retention becomes an actual decision the moment somebody signs for it.
Strategic fit decides which exposures are worth carrying
Not every exposure should be reduced. Some are the direct cost of the strategy, and removing them removes the position that made the business worth building in the first place.
A concentrated customer base is an exposure and frequently also the reason margins hold. Operational excellence in this work is knowing which exposures are load bearing and which are merely tolerated because nobody examined them.
Strategic fit is the test separating the two. An exposure the strategy requires earns structural attention and a survival plan. An exposure the strategy does not require gets removed, and stakeholder value improves in either direction.
Structure is what protects the people carrying the exposure
The argument for building this is not documentation quality. Ambiguous risk ownership is absorbed by staff as personal exposure, and human capital erodes under that condition faster than under heavy workload.
Someone who cannot tell whether an exposure belongs to them will escalate it, wait on it, or work around it quietly. Each response costs them standing, and none of the three appears on any report. Servant leadership expressed operationally means naming the owner so the ambiguity stops being theirs to absorb.
Composure follows from that clarity more reliably than from any control. Teams who know who holds what will raise problems earlier, and early problems cost less than late ones by a margin no documentation can match.
Watch the full explainer
Related
Further material on management consulting and operational structure from World Consulting Group: [www.worldconsultinggroup.com](https://www.worldconsultinggroup.com)